
For the third year in succession there was an increase in the number of businesses who took part in the survey and submitted either an online or postal response to our questionnaire.
All the responses are anonymous so we have no way of knowing actually how many new respondents there are this year, but it seems reasonable to assume that businesses who have filled in a questionnaire in previous years are more likely to continue to do so.
Which region of the UK does your business operate from?
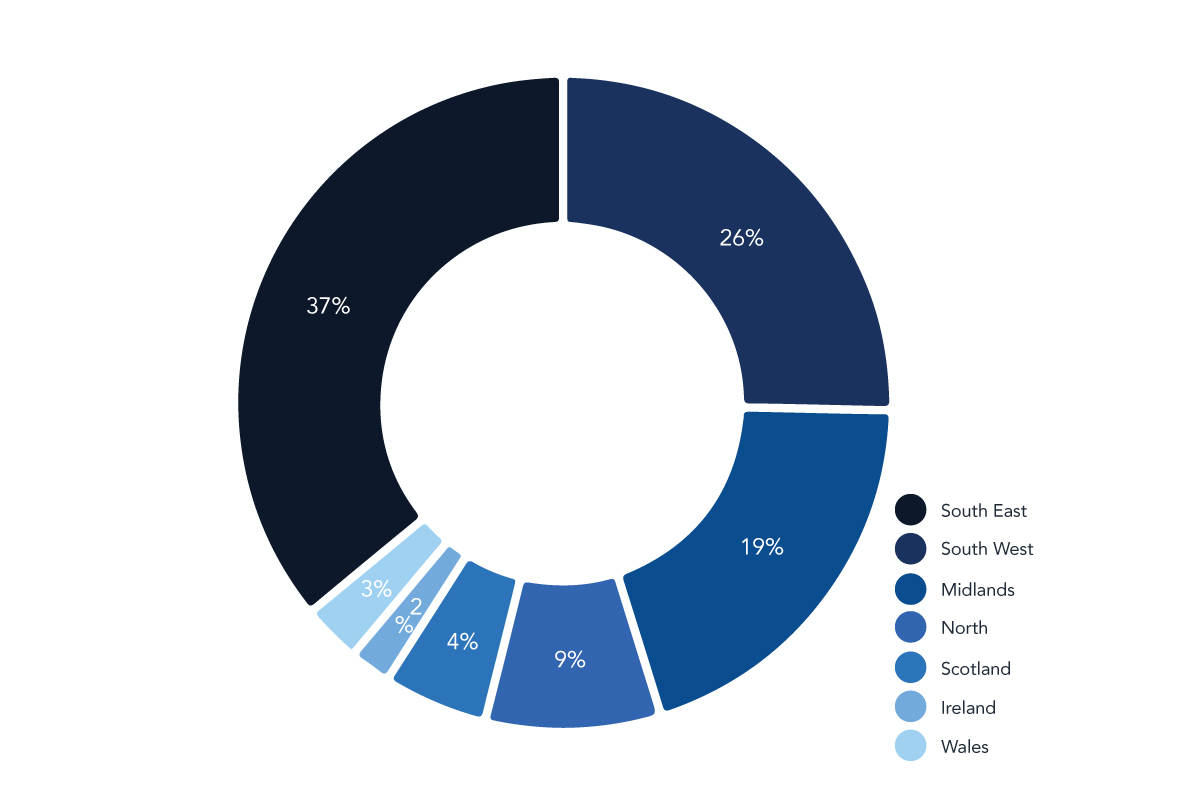
The South East remains the region where the largest numbers of businesses operate; although as a percentage of the respondents its dominance has fallen slightly from 42% in 2012 to 35.7% this year.
All of the other regions with the exception of Wales and Scotland showed slightly higher numbers of respondents than in previous years.
It should be remembered that these figures don’t really show regional growth – or a lack of it. They simply show where the survey respondents are based. (Some businesses operate nationally, some in more than one region.)
The relative strength of the South East, South West and the Midlands corresponds accurately to the regional variations that were shown in an Office for National Statistics survey on disposable income per head which was published in 2012 so, put simply, these are wealthier areas where people have more money to spend on wet leisure.
The anomaly is Scotland, which did well in the survey on disposable income but is under-represented in our wet leisure respondents.
How many employees do you have in your business?
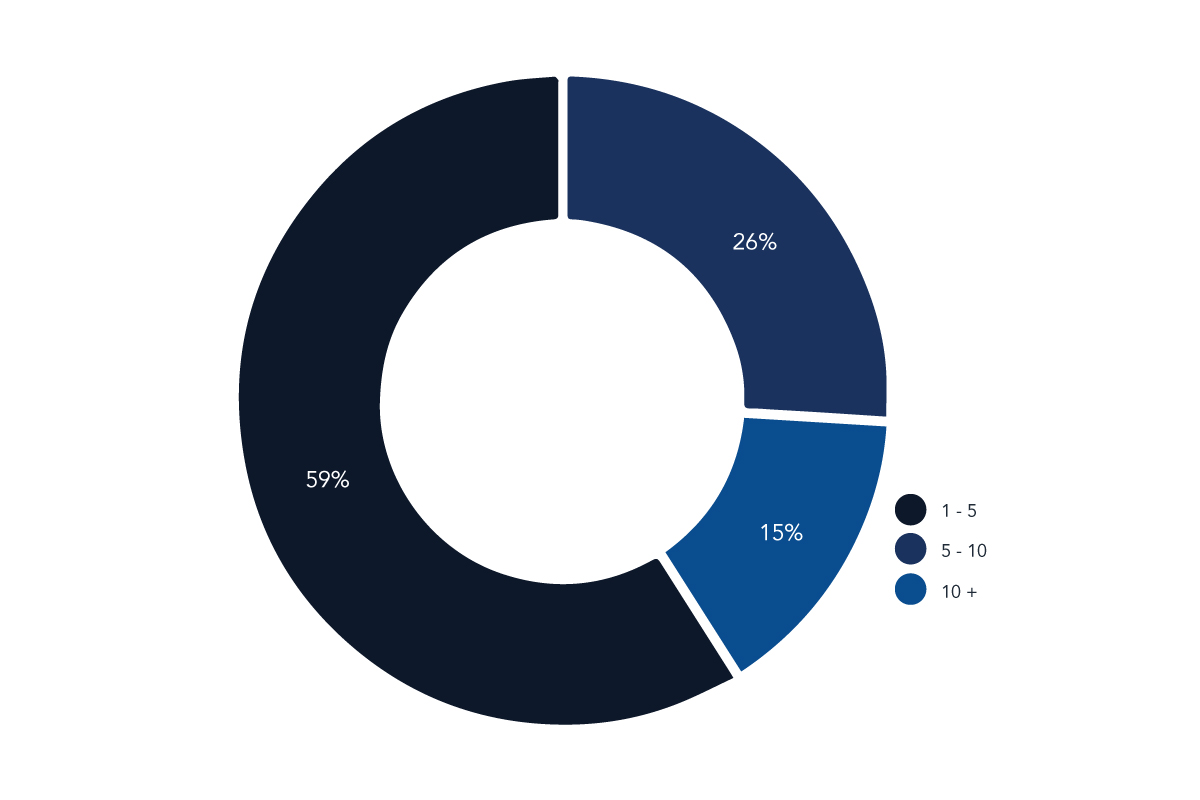
Last years survey reported a significant rise in the number of respondent businesses who employed 10 or more people.
This years survey shows an equally significant drop in the same group. Businesses with 10 or more employees have fallen from about 26% to just over 15%.
It certainly appears that the businesses that responded this year are employing less people.
When a survey, such as this, doesn’t poll exactly the same respondents each year you should exercise a little caution when drawing conclusions from changes in figures, however one possible answer is that businesses are becoming more efficient.
The last few years has seen the UK in recession and businesses are constantly under pressure to cut costs; but no one likes firing staff. So reductions in the number of employees a business has tend to lag behind the economic pressure that drives those decreases in staff numbers.
Which sectors of the wet leisure industry do you serve?
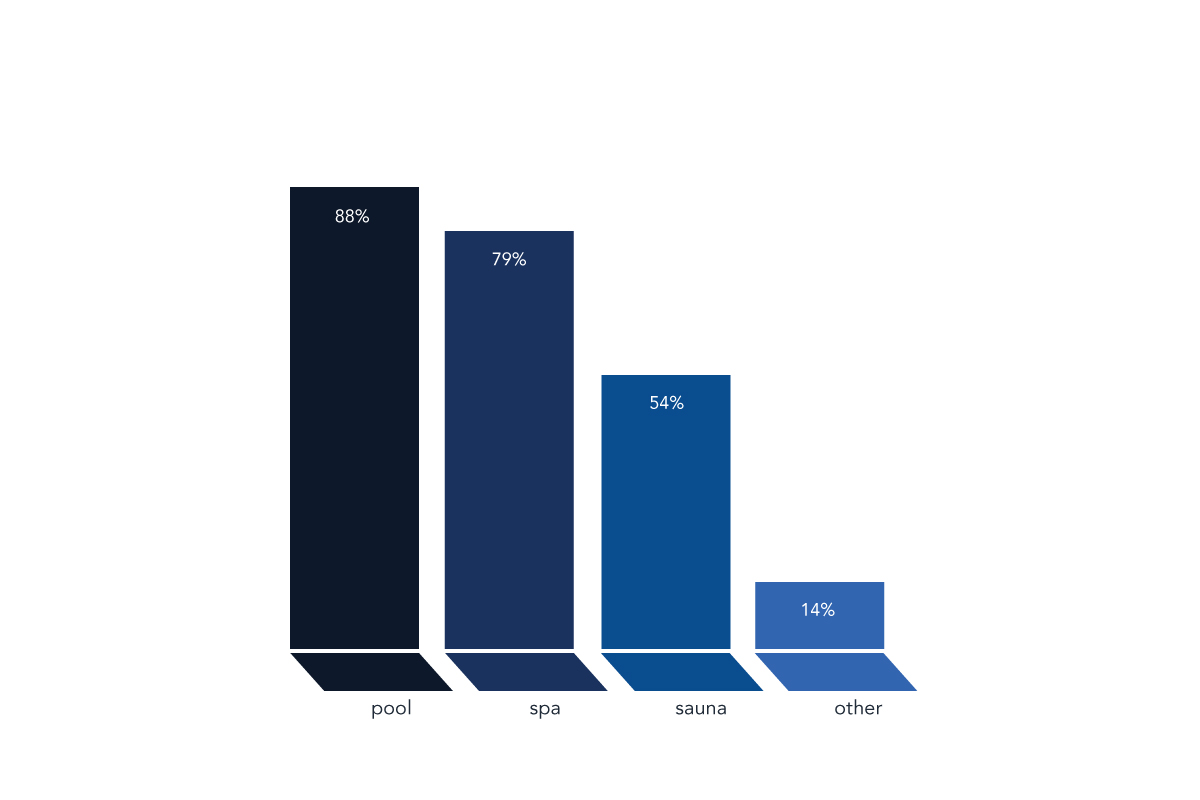
The underlying trend for wet leisure businesses to operate across all three sectors of the industry continues.
The growth of the sauna sector continues; this year with over 50% of respondents involved in selling and installing saunas as opposed to just over 40% in last years survey.
Where the growth in sauna is occurring can be seen in more detail in some of the specific responses to the question. ‘Spa developments’, ‘steam rooms’ and ‘bathrooms’ were all areas specifically mentioned and perhaps point to the fact that this area is growing and developing in a slightly different way to where we would see ‘traditional’ wet leisure business.
Are your customers and clients domestic, commercial or a mixture of both?
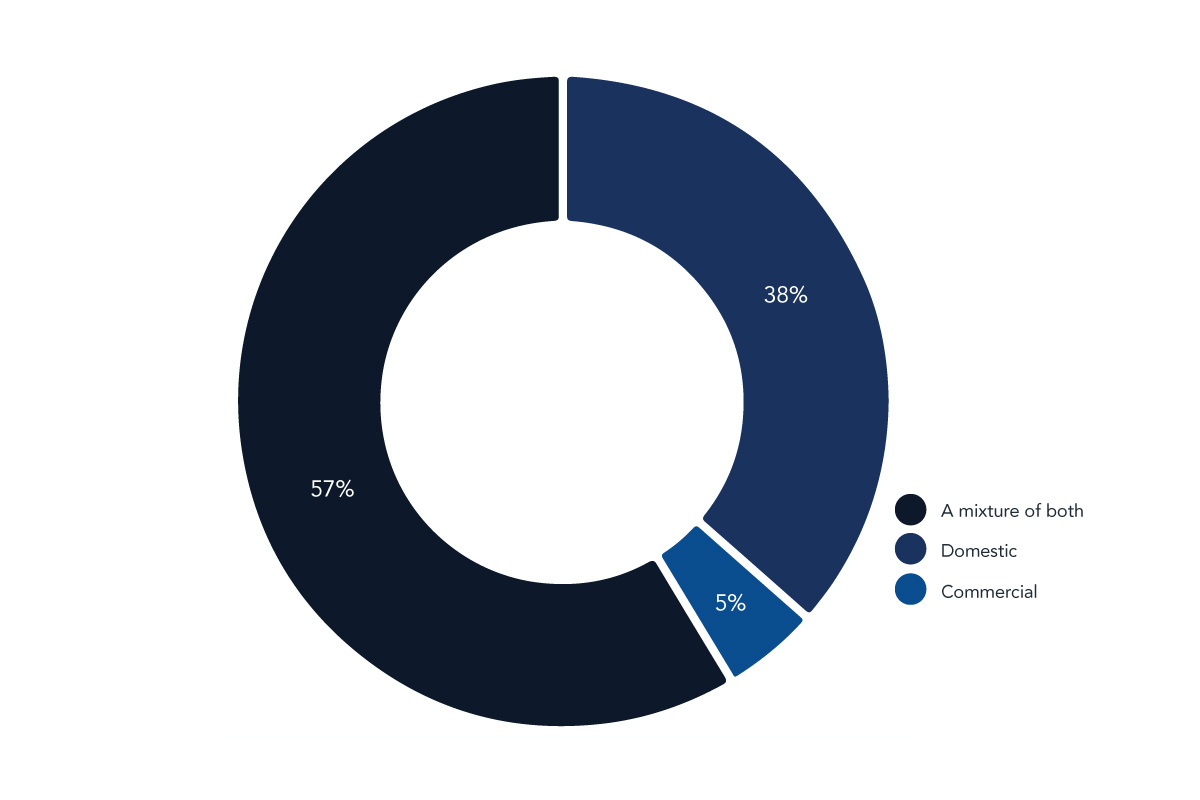
The responses to this question in this years survey were broadly similar to the 2012 results.
Businesses working in a mixture of both the domestic and commercial sectors remain the most common type of business in the wet leisure industry.
What are the services that you offer your customers?
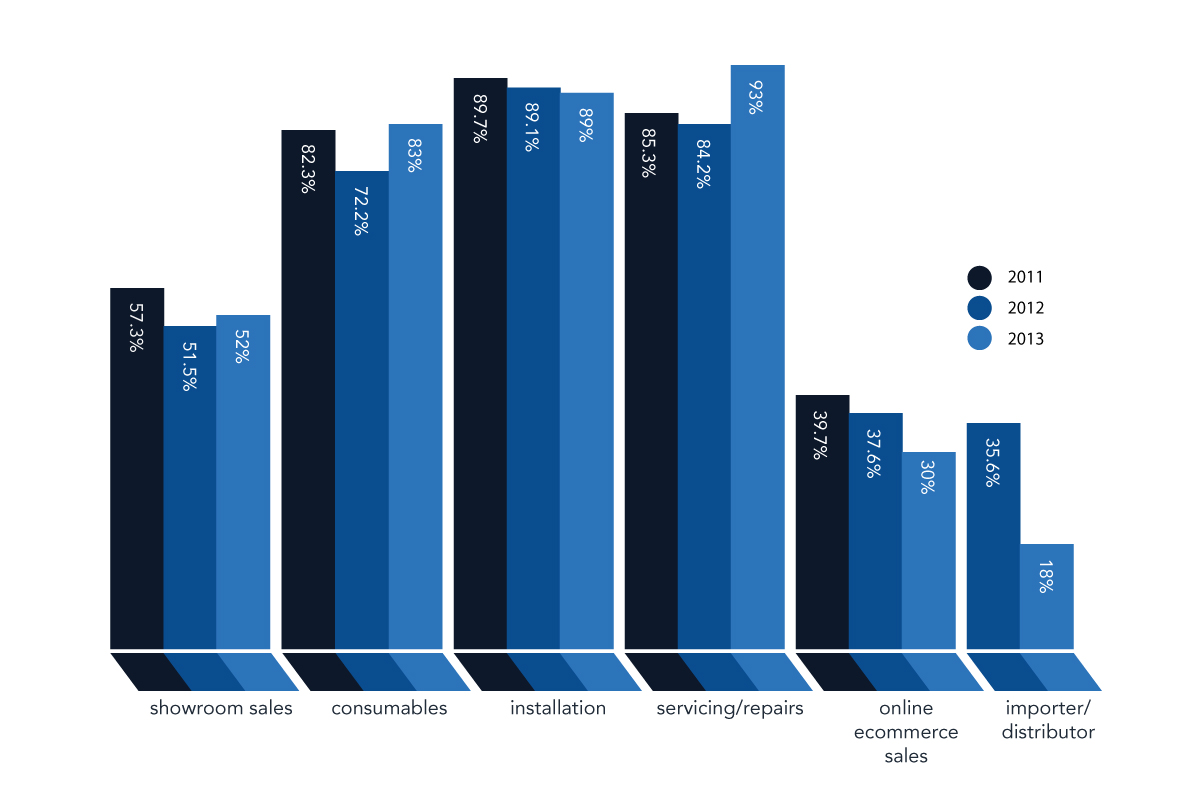
In terms of the services that respondents offered their customers, once again the picture has remained fairly static.
There are two areas of change however; the first is a rise in consumables that is mirrored by a rise in service and repairs.
Could these two be linked? It seems reasonable that offering consumables is at least associated to servicing a customer’s pool or spa. The UK’s DIY culture is probably on the wain and certainly at the upper end of the market or with a more complicated installation, it seems more and more likely that a pool or spa owner will call in a service professional.
Another factor must be that the overall number of pools and spas in the UK that are running is on the increase. They are being built and installed at a greater rate than they are being decommissioned or coming to the end of their useful lives.
The second area of change was a slight decrease in the percentage of respondents who were involved in e-commerce. That group fell from 37.5% to just over 31%. The fall is not a dramatic one but does suggest that web-based retail businesses don’t have things all their own way. They may have lower overheads but price comparison on the Internet is easy and margins are often forced lower and lower.
“Prices have to be kept keen with Internet competition so our margins were 3% down.”
