
The more businesses that take part in the survey, the more accurate the picture that we can draw and share.
Businesses have the opportunity to submit their responses either via an on-line form or by filling in a postal questionnaire. All responses are completely anonymous.
The number of responses has grown year on year and so the insights that this survey can draw become more meaningful, our understanding of the industry grows in scope and accuracy and the value of those results becomes greater to everyone who works in our industry.
This year’s results were gathered between October 2014 and January 2015.
Which region of the UK does your business operate from?
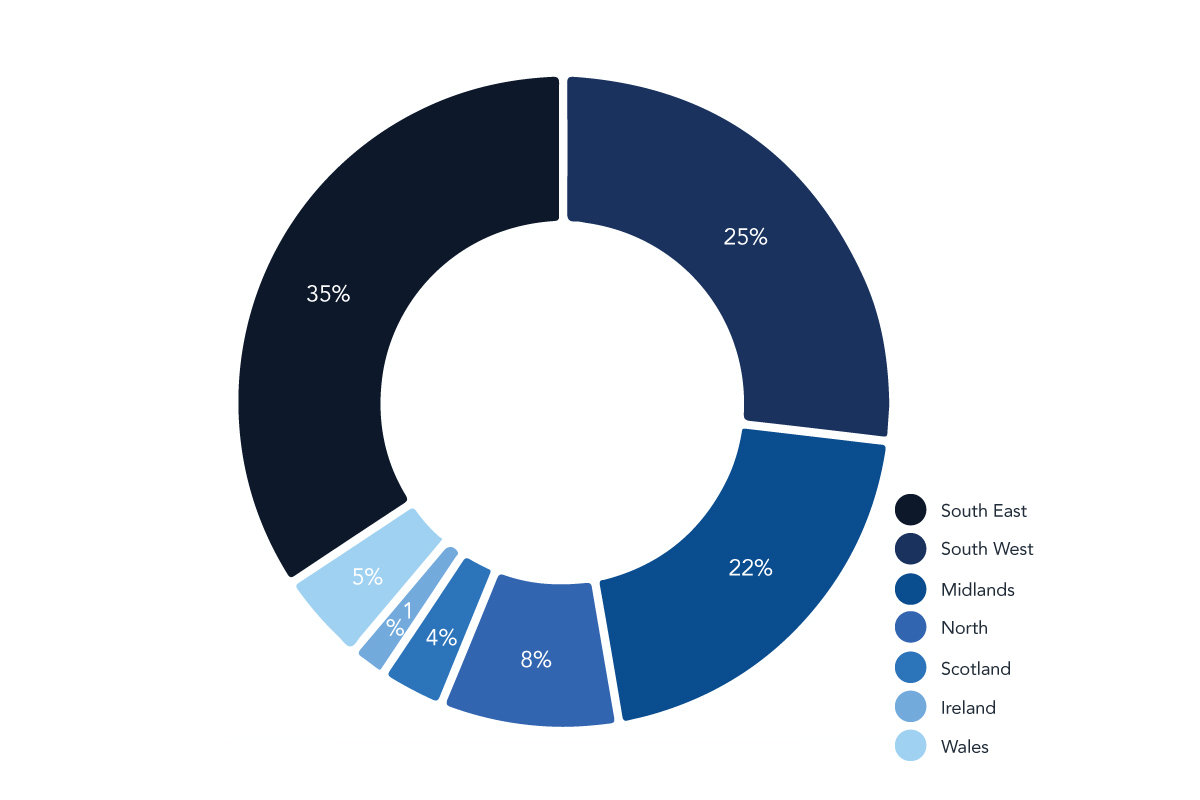
Not surprisingly, the South East, South West and the Midlands remain the ‘big three’ and that corresponds to their relative strength within the UK’s economy as a whole.
Looked at in those terms, Scotland remains under-represented by wet leisure businesses in comparison to the strength of its economy and the amount of disposable income that government surveys suggest lies within the country.
In fact, when we looked more closely, businesses in Scotland were much less likely to be operating in the pool sector than the survey average and were reporting very few customers from what was described as the ‘top end’ of the market.
The South West has shown consistent growth and now represents 27% of respondents compared to 17% in 2011.
How many employees do you have in your business?
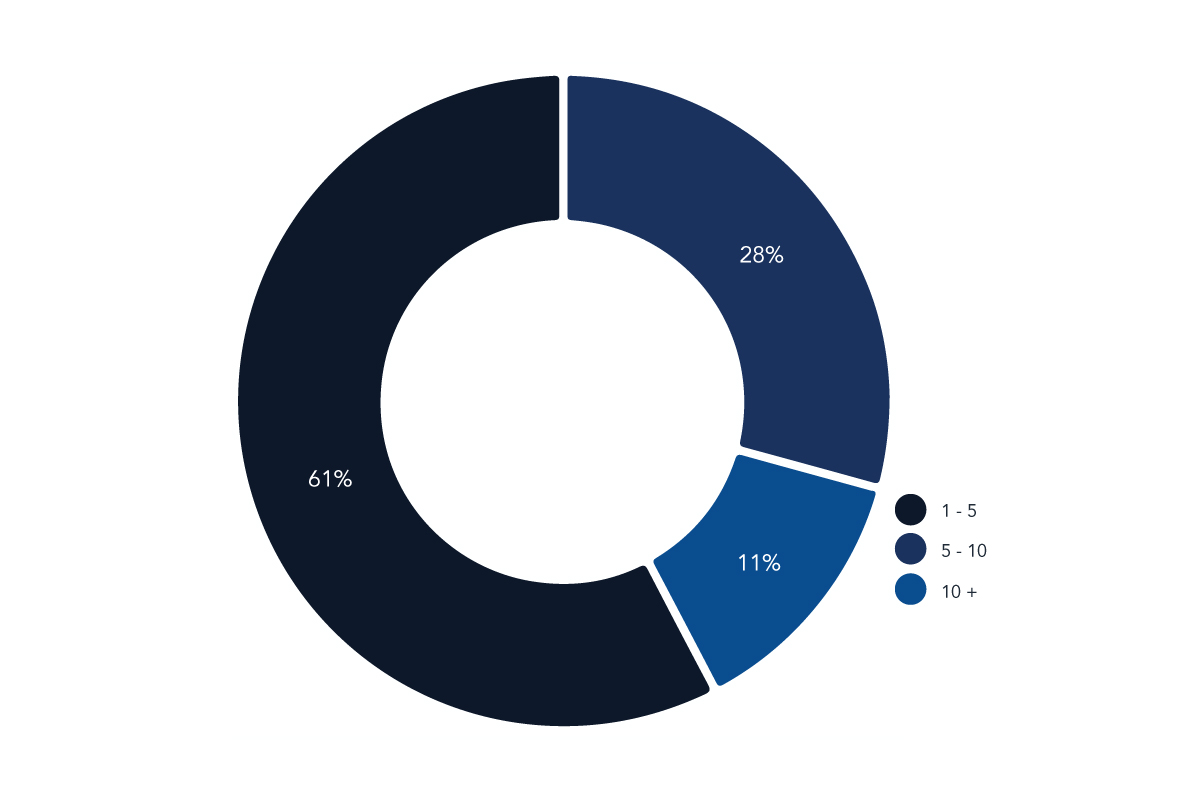
The relative proportions of business size ranked by employee numbers have stayed roughly similar from last year to this.
However, if we look back to 2011, the percentage of businesses employing 5 – 10 people has doubled from 15% to 30% while the number of larger businesses employing 10 or more staff has stayed roughly the same.
Which sectors of the wet leisure industry do you serve?
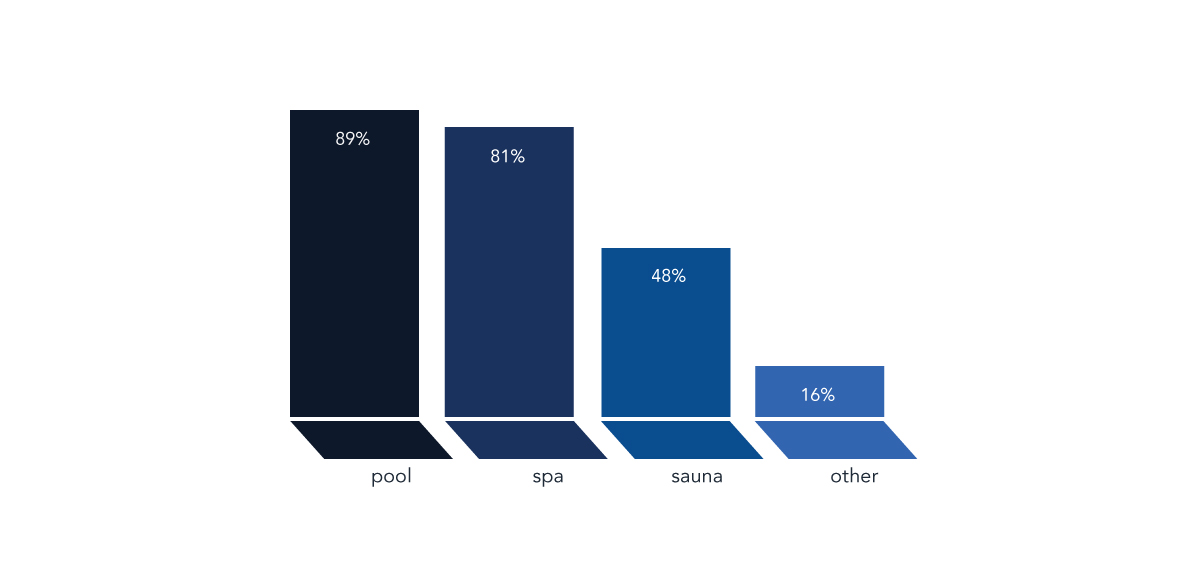
Although broadly similar to last year’s results, the graph above shows a very slight drop in the relative number of businesses operating in the sauna sector.
Respondents were however given the opportunity to add more detail if they ticked the ‘other’ box and these responses point to a new area of growth. Steam.
Almost 50% of businesses that ticked ‘other’ clarified their response by saying that they were installing steam rooms and steam showers.
The wet leisure business seems to be more and more influenced by our customer’s interest in health and desire for ‘wellbeing’. Perhaps we should all challenge the ‘traditional’ view of what constitutes the wet leisure industry.
“Experience showers, underwater treadmills, steam rooms, hyperboric chambers, Wellness in general.”
Are your customers and clients domestic, commercial or a mixture of both?
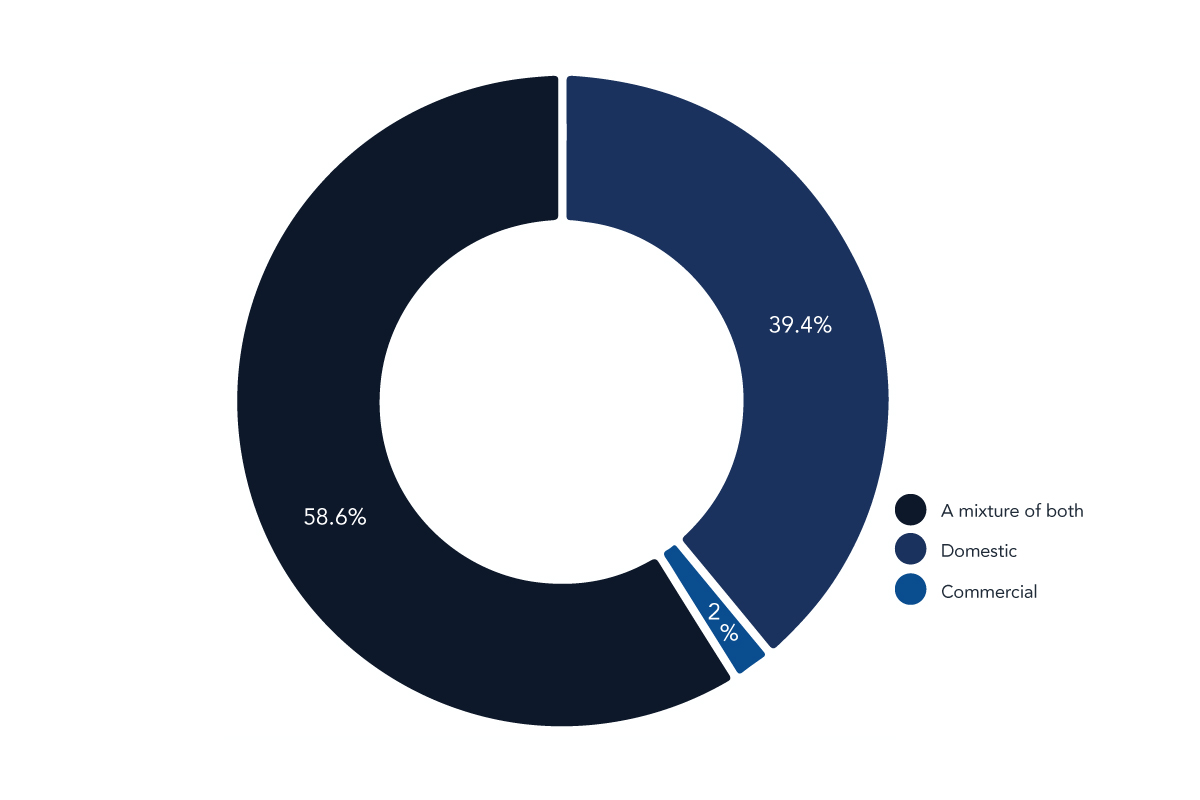
Businesses working in a mixture of both the domestic and commercial sectors remain the most common type of business in the wet leisure industry.
The number of businesses working purely in the commercial sector has shown a steady decline. Government spending cuts affecting municipal pools and leisure centers may well have contributed to this trend.
What are the services that you offer your customers?
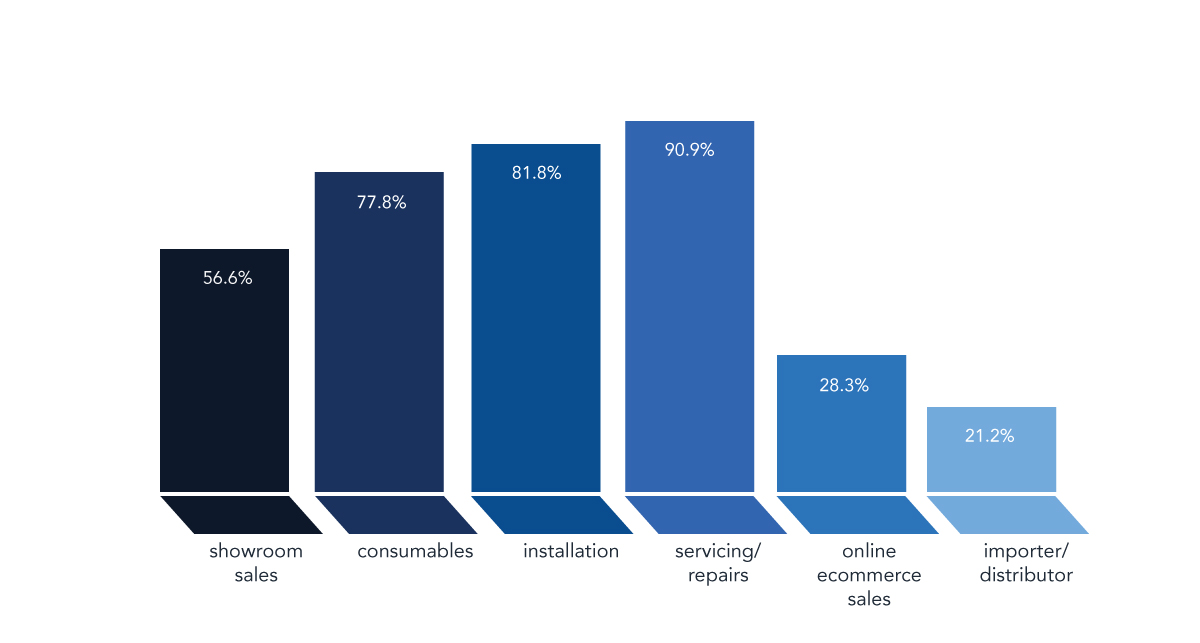
Very little change compared to last year, but if we looked back to 2011 we would see an industry where installation was the biggest service offering with service and repairs coming a close second.
As installations become more complicated, as time becomes more and more of a precious commodity to our customers, they are more likely to call in service professionals.
This graph shows that service engineers are perhaps the face of the wet leisure industry that our customers are most likely to see and so points out their importance in terms of customer satisfaction and as people who need to be involved in sales of retrofit products or of new, improved installations.
“We have survived this recession on refurbishment, service, repair, chemical supply and upgrades of equipment. We all need to keep looking for the add-on’s we can sell to our existing customers.”
