“How was it for you?” At the end of 2012, that was the question on everyone’s lips in the wet leisure industry.
For the last 12 months, the media has been full of doom and gloom and it seems as if the skies have been full of cloud and rain, so this chart was never likely to be the most cheery one.
In last years survey we asked people what their expectations were for this year and so we have a chance to compare a forecast with the facts.
How was it for you?
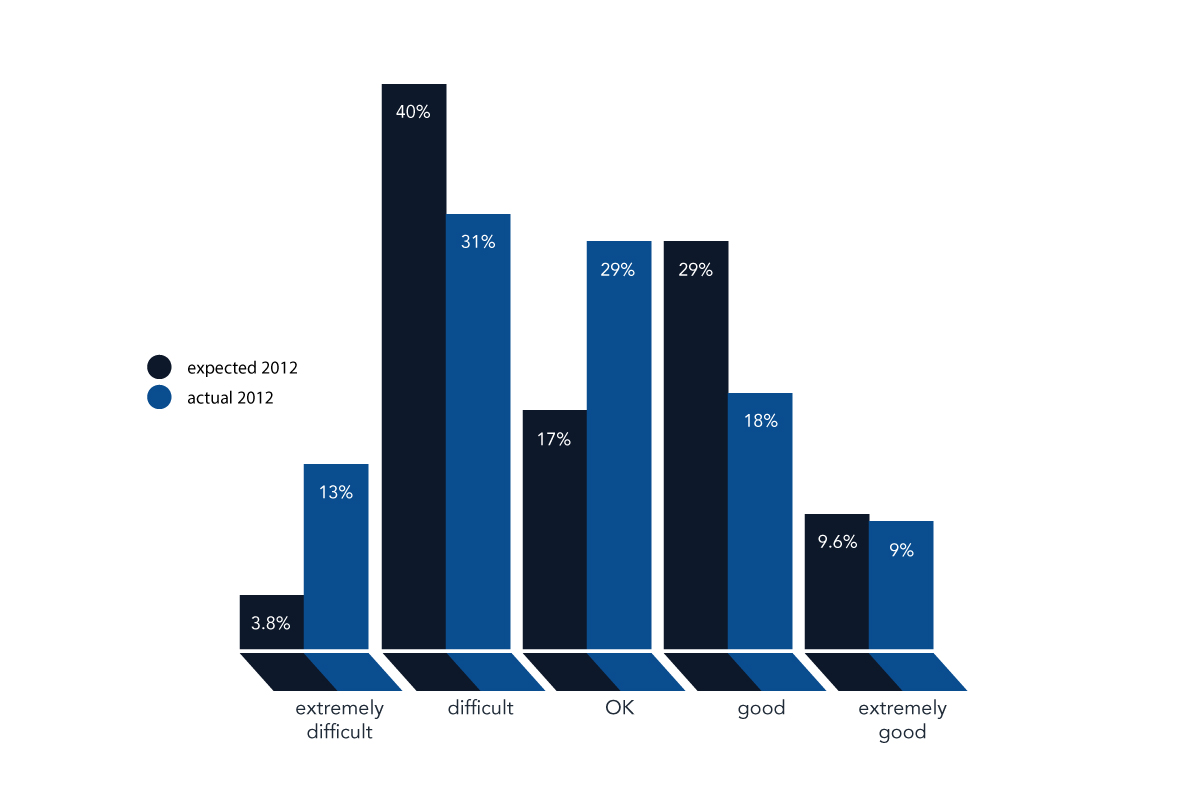
 3.8% expected 2012 to be an extremely difficult year but 13% actually found it so.
40% thought 2012 would be simply difficult but only 31% found that to be true.
‘OK’ had a 17% forecast but 29% looked back on the year and described it that way.
29% of people expected 2012 to be ‘good’ and 18% experienced it as that.
‘Extremely good’ had a 9.6% forecast and a 9% review.
So, we had four swings of approximately 10% with increases for Extremely Difficult and OK, and decreases for Difficult and Good.
This could be analysed a number of ways – and because the responses are anonymous we have no actual way of knowing – but it seems most likely that the changes took part on their own sides of the median line.
That is to say that someone expecting a positive outcome for 2012 didn’t suddenly find himself or herself reporting an extremely difficult year after the event but rather that 10% of those expecting a difficult year found it extremely difficult and 10% of respondents expecting a good year found it merely OK.
Another way of looking at the results is to note the rating averages.
The forecast for 2012 in last years survey had a 3.00 rating average. The rating average when looking back over the year has fallen to 2.79 (where 1 is extremely difficult and 5 is extremely good).
There is of course one final observation on the date from this question.
9.6% of businesses forecast an extremely good year and 9.0% of businesses achieved it. Are they the same businesses? Almost certainly, yes.
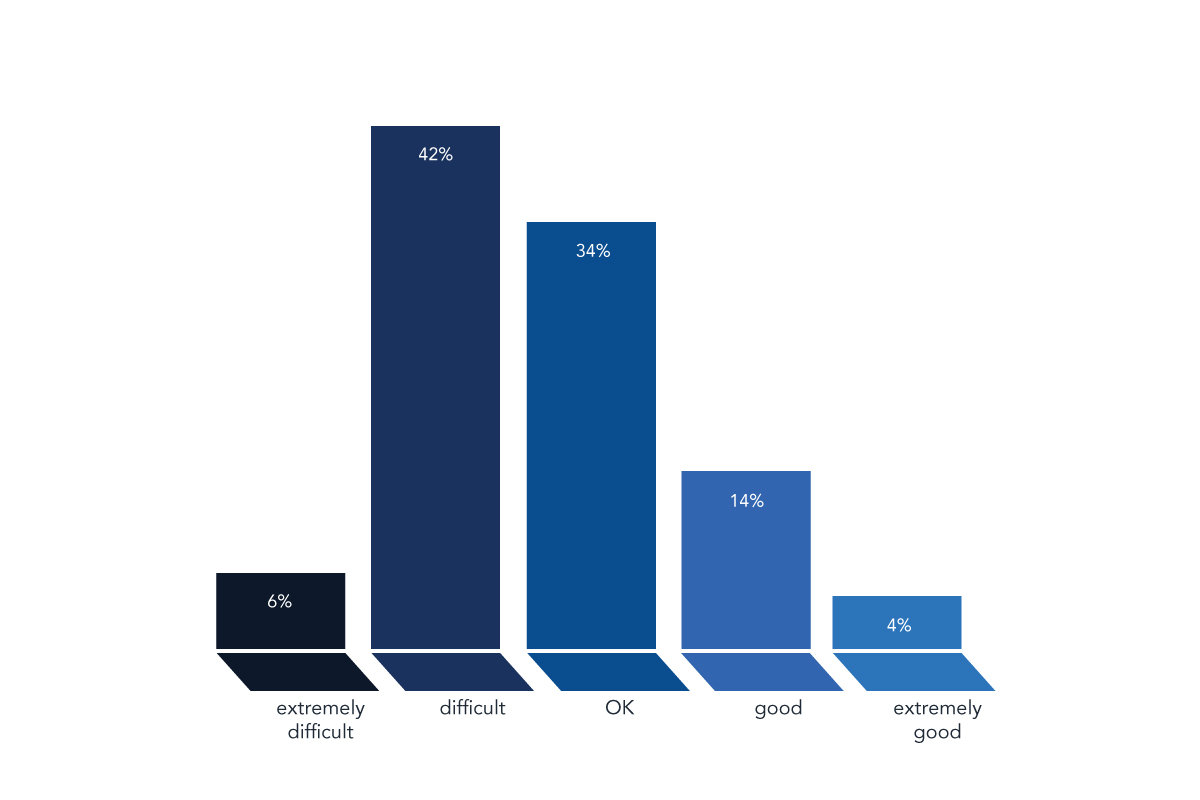
How do you expect business conditions to be next year?
 Once again we asked respondents to give their forecast for the year ahead, for business conditions in 2013, and once again the rating average drops; this time to 2.68.
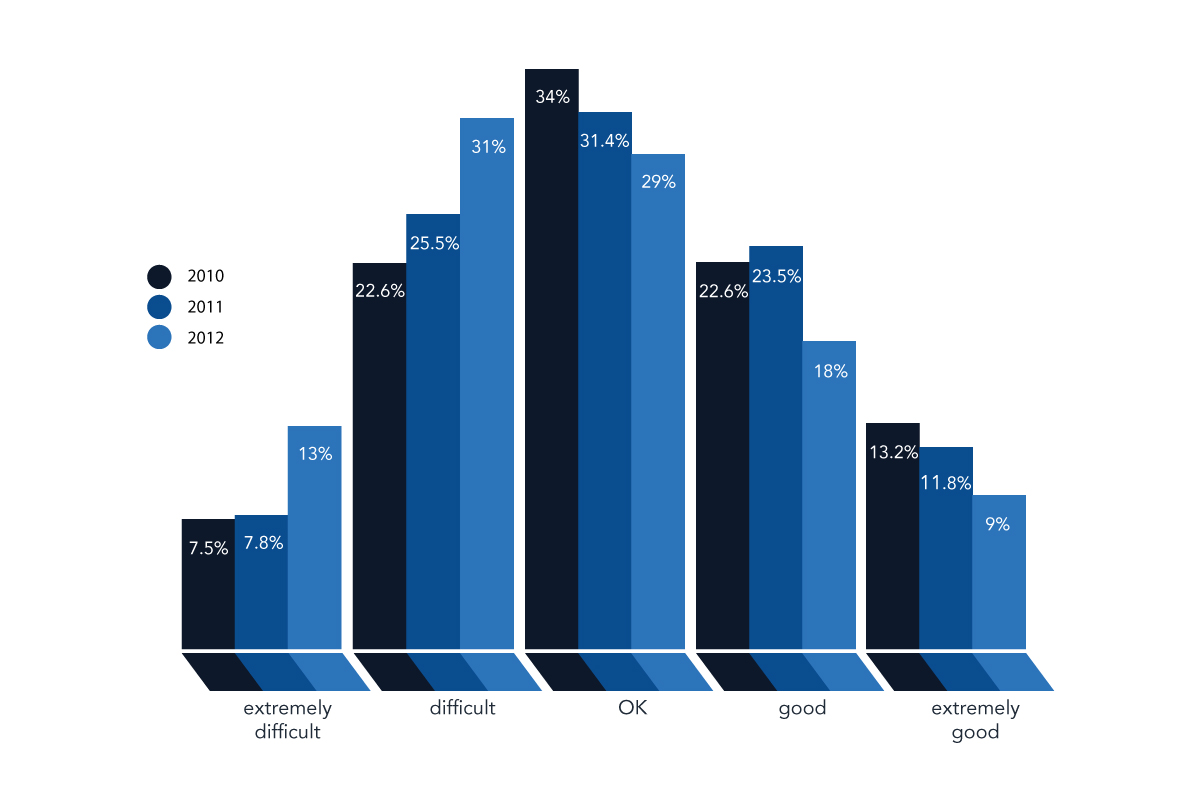
That in itself is pessimistic enough but to put it into context, the rating average for 2010 – which we asked about in last years survey – was 3.11. The following graph shows business conditions, as they were experienced over the three years.
Business conditions over three years.
 That graph doesn’t paint a very pretty picture and many of the comments from survey respondents echoed that view.
“ It does seem that we can talk ourselves into depression. If you think negative then the chances are you will not commit 100% so in turn more likely to fail.”
“BBC and the media are to blame!”
“The Hosepipe ban. The Rain. The End.”
Not only did we ask for people’s levels of confidence and expectations, we also asked for sales figures.
The results are surprising particularly when seen against the mood in the industry as shown above.
2011
2012
 These figures clearly show growth in the industry.
This year’s sample includes a higher percentage of larger businesses than last year. 26% of respondents were businesses of 10 or more employees compared to 19% in the 2011 results. That may have some affect on these tables.
It may well be that the disparity between sales and business confidence reflects shrinking margins and therefore shrinking profits.
It may be that recessions are as much about business and market confidence as they are about the numbers. In all probability all of these factors are at play but the rise in sales figures shown by the survey remains a fact. So now it’s time to, as they say on ‘Dragon’s Den’, to drill down into the figures.
The first sector that we looked at was the 9% of respondents who had enjoyed an extremely good year. What similarities or commonalities were there across that group?
Only half of the businesses were in the ‘affluent’ South East of the country but over 75% of them were larger businesses with 10 employees or more and none of them were in the 1 – 5 category when it came to employee numbers.
They were involved in the pool, spa and sauna sectors and hydrotherapy was also mentioned specifically.
Only one of the businesses was purely domestic with 22% involved solely with commercial contracts and the rest (68%) doing a mixture of business and commercial.
Both showroom sales and e-commerce were lower than the survey norms but interestingly weren’t bothered by internet competition and simply cited the weather and the economy as negative forces affecting their trading year.
In terms of actual products sold or installations completed they were active across all areas but had a far higher level of swimspas and steam showers or steam rooms than the industry average.
83% of these successful businesses described their clients as ‘top end’ of the market.
Their concerns for the 2013 business year were much more about the problems of expansion than recession. Although they admit that they work in a highly competitive area of the market, 30% of their business concerns for next year were about finding and recruiting high quality, experienced staff.
Obviously, it then made sense to focus on the 13% of respondents who had suffered from an extremely bad year.
These businesses were spread more evenly across the country although over 40% of them were from the South East.
Of course, almost half the survey respondents do business in that region. Of this group though, 77% were smaller businesses with 1 – 5 employees and 70% of them dealt solely with the domestic market; a complete reversal of the previous group.
They were more focused on the pool sector and showed less diversity of products. 50% of their business was described as ‘middle’ or ‘budget’.
On the bright side, 75% of this group expected things to improve in 2013.
This group saw the media and its reporting of both the recession and the weather as having a negative influence on their businesses, they were equally unhappy with the effect of both the Olympics and Jubilee and were concerned about internet competition.

