On the following scale, how did you find business conditions this year?
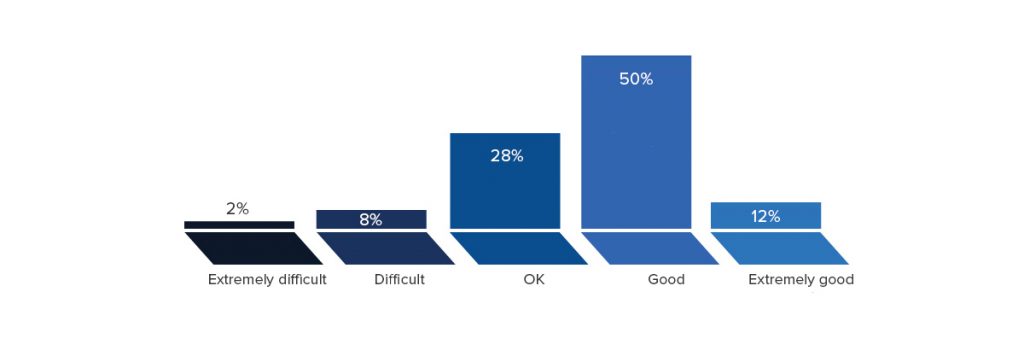
 Over 90% of the survey respondents enjoyed a year that was somewhere between OK and Extremely Good.
That’s in a year that didn’t have the best weather during the season and was troubled by the uncertainties that came with the Brexit negotiations and a general election and those influences might explain why this figure is a little down on last year’s.
Unfortunately, there were some respondents who reported an Extremely Difficult year, but that was less than 1% of the survey sample. If we look back to the first survey in 2011 more than 7.5% of businesses were seeing business conditions in that way.
To put that in some perspective, the UK economy grew by 2.2% during 2016. It was the seventh consecutive year of growth since the recession and left the economy 8% larger than its pre-crisis level. House prices rose by an average of 6.9%. The employment rate was high nationally, although there were big regional variations, and the median household income for a childless couple after tax rose to £25,500. Having said that, the Office of National Statistics is quoted as saying, ‘Retired households’ incomes have soared in recent years.
If we look at regional variations, London and the South East have a higher than average household disposable income and the South West has the UK’s highest proportion of retired people.
What would you say were the things that had the biggest influence on your business this year?
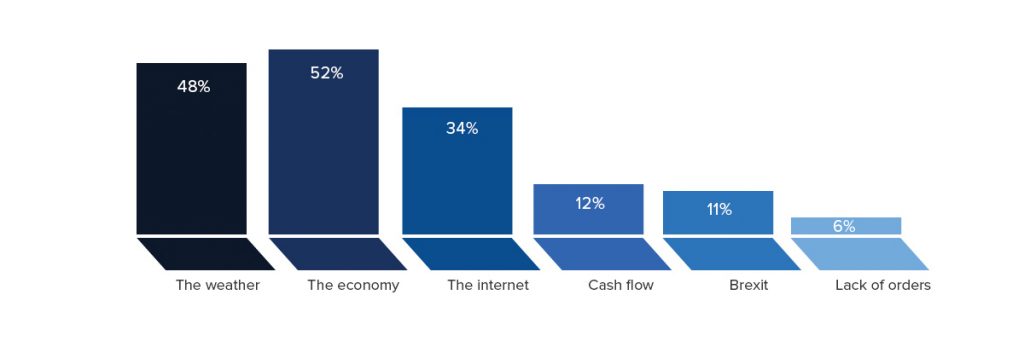
 For the second year in a row, the survey sample saw the state of the economy as having the greatest impact on this notoriously weather-sensitive industry of ours.
If we look at a word cloud drawn from the respondents’ actual comments, then it is even more noticeable.
We have taken a look at how the economy was performing in 2017 but what about the weather?
The UK 2017 summer was wetter but also warmer than average. It was the 11th wettest summer on record and the insights from previous Wet Leisure Industry Surveys suggest that rainfall has more of an effect on business than temperature.
The season began well with June ranking as the fifth warmest since 1910, and it appears that business reflected that with many businesses experiencing a good start to the season, which then slowly tailed off.
On the following scale, how do you expect conditions to be next year?
The overall shape of this graph is the same as the responses regarding business conditions in 2017.
The slight differences are most noticeable at the two extremes with more businesses expecting an extremely difficult year and less expecting an extremely good one.
This pessimistic view of the future, particularly when the industry has actually enjoyed a relatively good year is a recent trend – this year and last – and seems to be influenced by larger outside factors such as Brexit.
During 2017, how many of the following products did you install?
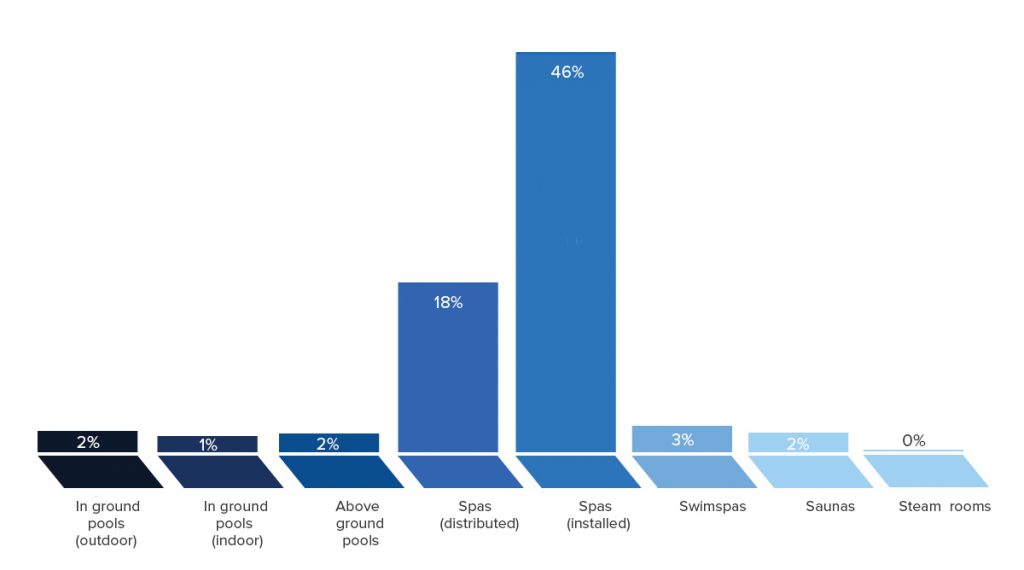
Spas and hot tubs were always going to be the big sellers so no surprises here but this year we have differentiated between distributor and retail sales to avoid the possibility of the same spa being counted twice.
However, in order to compare with previous years we need to look at the combined figure. Last year we recorded combined sales of 3,446. This year, if you combine the two figures – 861 and 3,196 – you get 4,057.
This year, the average retail sales over the course of the year, were 45 units per dealer.
There has been movement in the pool sector with survey totals of 132 outdoor in-ground pools (147 last year), 74 indoor pools (133 last year) and 81 above ground pools (12 last year). These are, of course, numbers reported just by the survey sample and do not indicate industry totals.
Nevertheless the above ground pools figure shows a massive increase over last year’s figure and as these types of installation are often seen as leading on to more expensive, in-ground pools that could be good for the industry.
Sauna sales have dropped from 186 to 103 where as steam rooms have increased from last year’s survey total of 43 to this year’s figure of 53.


