The questions and their responses so far give a good, overall picture of the wet leisure industry in the UK. They tell us broadly what sorts of businesses are in operation in which areas and what sectors.
Of course, what we are all interested in is, how are those businesses doing?
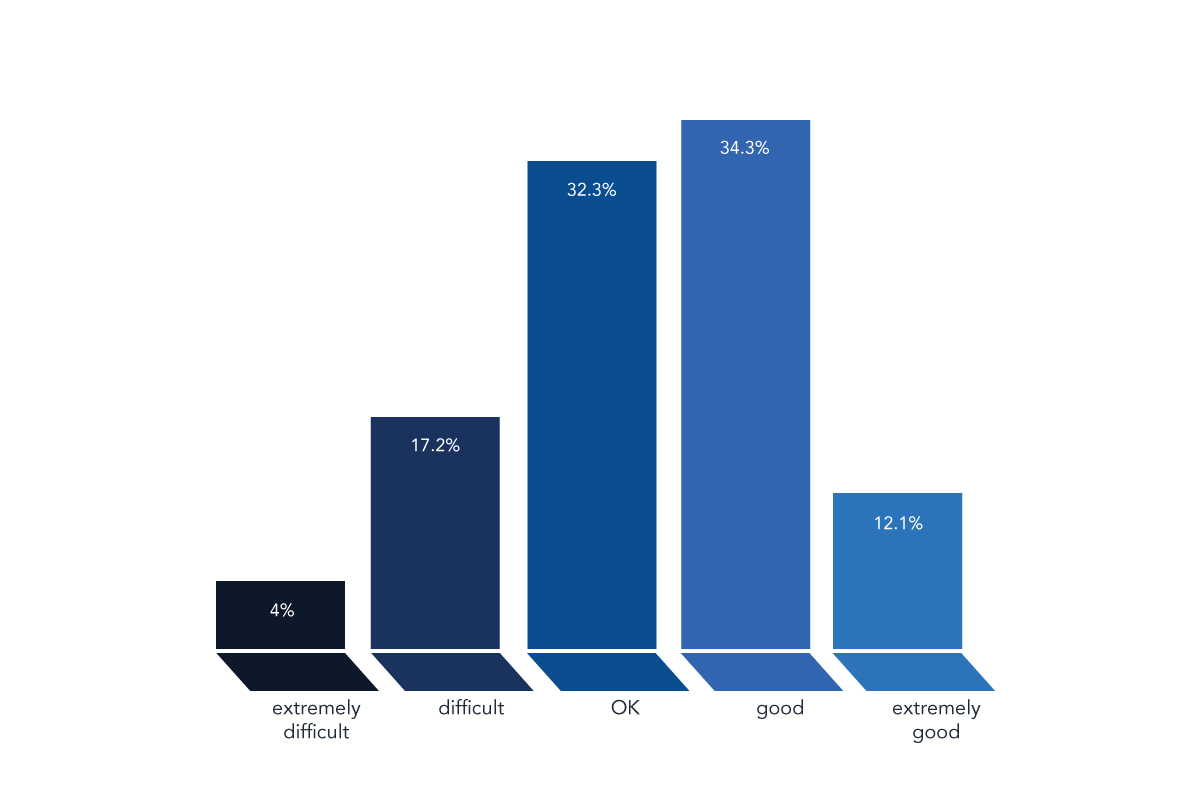
On the following scale , how did you find business conditions this year?
 The results show what appears to be a pretty healthy industry.
Some businesses will always have an extremely difficult year, not necessarily because of market conditions but because of challenges and problems specific to that business.
The same is true for businesses that have an extremely good year. No matter how hard a business works or how buoyant a market is, luck will play a part in any particularly successful trading period.
But almost 70% of businesses reported a year that was ‘OK’ or ‘Good’. That seems impressive. Yes, we had a better summer than we have endured in recent years but much of the media coverage on the economy is still about austerity and slow growth.
Of course, one of the most important benefits of this survey is not just to see how things have been across our industry but to have some information that can help us all plan for the future.
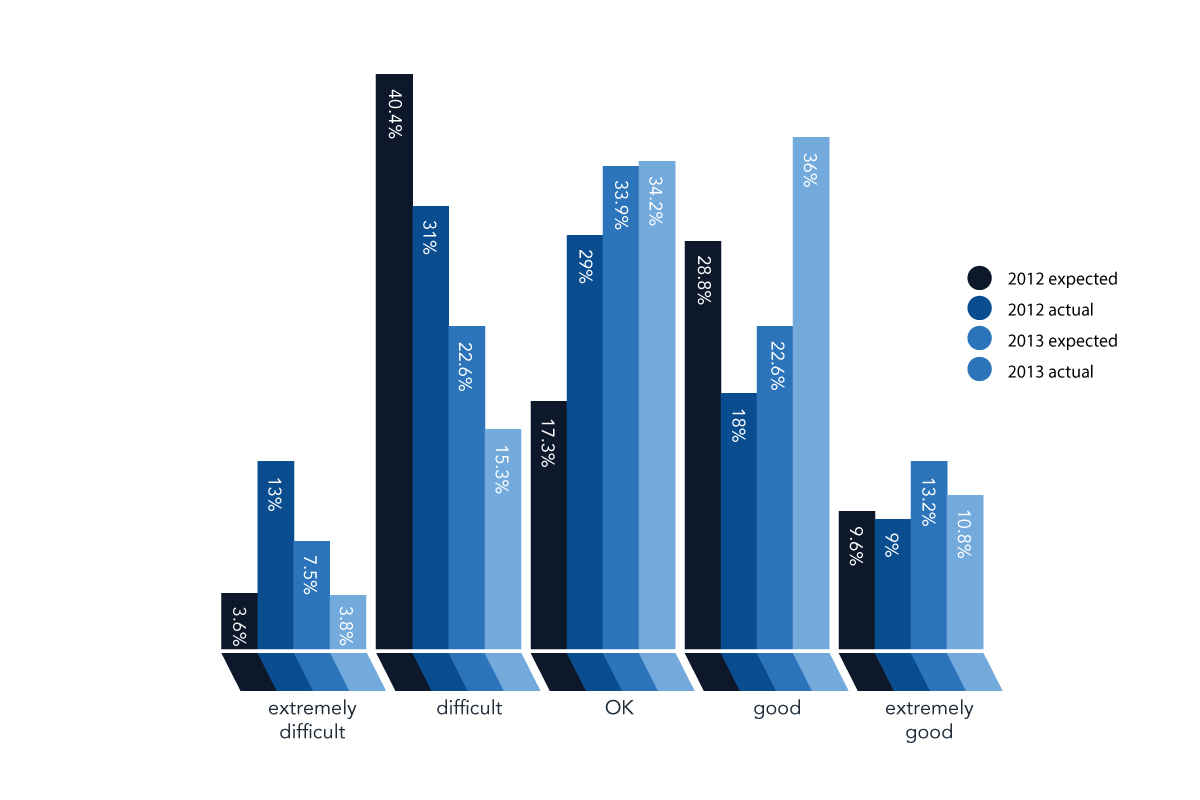
And in previous years we have asked businesses what they expected the following year to be like rated on the same, 5 point scale.
Expectation vs. Reality.
 So we can compare expectations with reality across the last two years and, in the main, what we see is that we are an industry of pessimists.
Looking at the middle ground of the table – ‘Difficult’ to ‘Good’ – businesses consistently expected a harder, less successful year ahead than they in fact experienced.
There is one exception; 28.5% of businesses expected 2012 to be a good year but only 18% experienced it as such.
Looking back, 2012 appears to have been a tough year with either ends of the spectrum – ‘Extremely difficult’ and ‘Extremely good’ – both reporting worse conditions than had been expected.
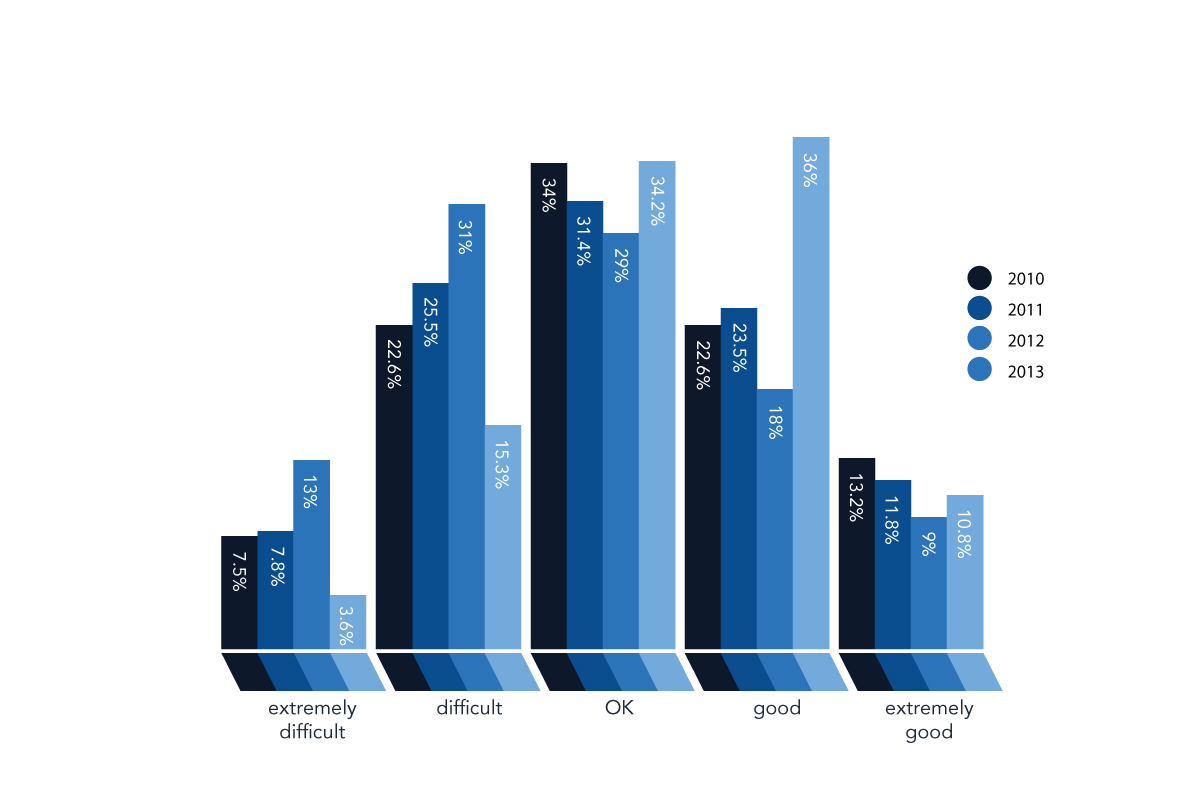
The Wet leisure Survey has now collected data on actual business conditions for 4 trading years – 2010 – 2013 – so what pattern does that show?
How did you find business conditions this year?
Our industry was having an increasingly difficult time until this year. The question must be, what caused that trend and what caused 2013 to go against it?
When asked, what were the things that had the biggest influence on your business this year, the weather and the economy consistently come top of the list and by a considerable margin.
The recession in the UK was at its deepest in 2008/2009 and the story since then has been of very slow recovery. However this year has shown signs of growth in the economy but would they be enough to influence such a change?
When we look at the weather over those 4 years, specifically the summer weather, we find a pattern that fits rather more persuasively.
“The weather is always the defining factor. The economy makes a difference, but poor weather – no matter how the economy is performing – is always difficult.”
The summer weather in 2010, 2011 and 2012 was not only poor, it got progressively worse over those years. Mean summer temperatures were consistently below a 30 year average but it was the rainfall that got heavier. 2011 was wetter than 2010, 2012 was the wettest summer on record with rainfall 157% heavier than the 30 year average.
2013, of course was different. 2013 was the sunniest summer since 2006 and the driest since 2003.
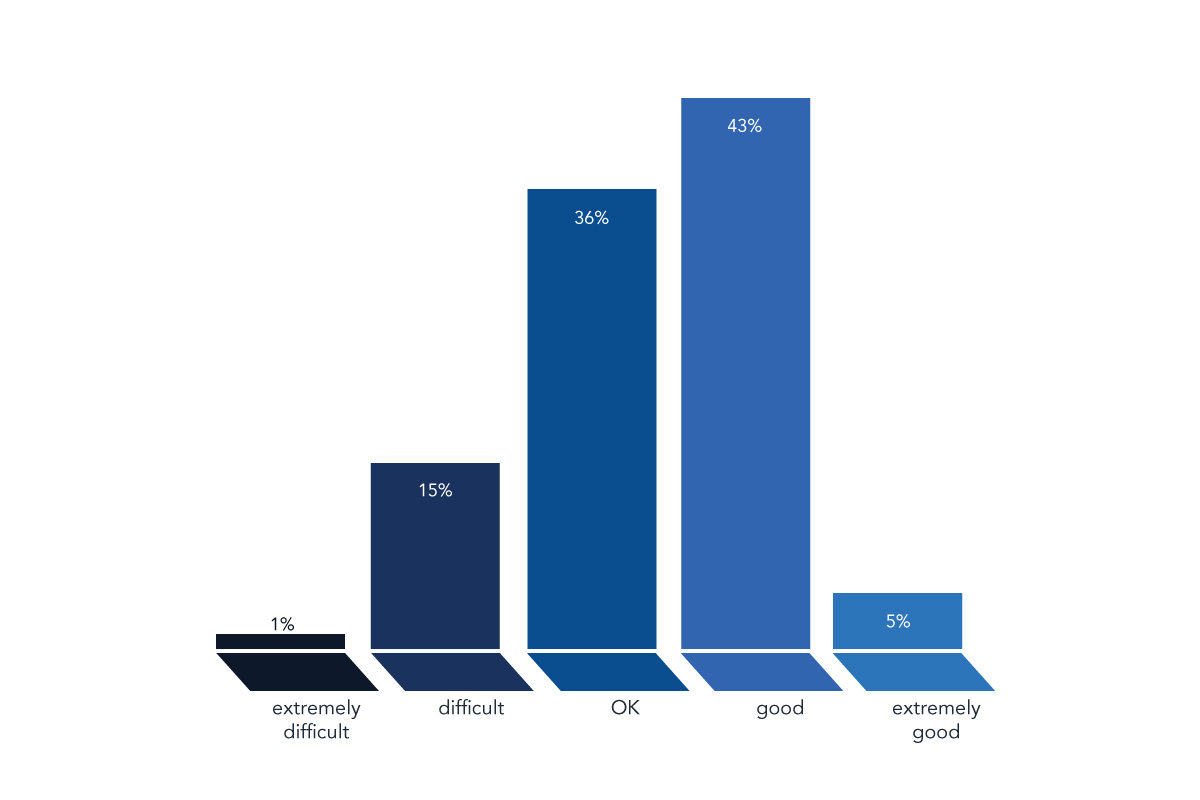
We asked the respondents to this years survey what their expectations were for business conditions in 2014.
How do you expect business conditions to be next year?
 84.3% of respondents expect 2014 to be an ‘OK’ year or better; a slight increase on the 81% of respondents who found 2013 to be ‘OK’ or better.
Which presumably means that they are expecting good weather in the summer.
As we did in last year’s report, the first group that we will take a closer look at are those respondents who enjoyed an ‘extremely good’ year in 2013.
10.8% of respondent businesses fell into this category – up from 9% last year. Over 80% of these businesses were in the South East, South West or the Midlands – but that should come as no surprise.
This year they were predominantly smaller businesses employing 1-5 people whereas in 2012 over 76% were in the 10+ category. This reflects the overall reduction in 10+ businesses that was noted earlier. These businesses placed almost equal emphasis on pools, spa and sauna, which meant that the importance of sauna had grown for them by almost 50% from last year.
Their focus on consumables and service/repairs had also grown from last year’s results but, once again that reflects an industry wide trend.
Interestingly, they feel no threat from the Internet and their use of social media and a brochure website was in line with industry norms.
In both years these businesses were predominantly working at the top-end of the market.
“We have pushed harder towards the top end market.”
In previous year’s survey reports we have then looked at respondents who experienced an extremely bad year.
This year, only 3.6% of the businesses that responded to the survey fell into that category and rather than look at such a small number of respondents more closely, we will simply wish them all the best for 2014.

